If you are already a user of clj-async-profiler, an embeddable low-overhead perf-based profiler for Clojure and Java, then the new 0.4.0 version will bring you a couple of exciting features. If you are yet to try it, check the introductory post, and maybe it encourages you to add clj-async-profiler to your toolbelt of performance analysis tools.
In this post, I will describe what's new in the latest version of the profiler.
Clj-async-profiler uses flamegraphs as the visual representation of profiling data. Flamegraphs are incredibly intuitive and easy to navigate compared to the visualization used in, e.g., VisualVM or JMC. However, it is not immediately apparent how to compare profiling results if you have two of them. Say, you implement an optimization or a change in the algorithm, and now you want to know how exactly that influences the performance profile. Is the change noticeable on the flamegraph? Did you gain some speed in one place only to lose it in another one? To answer these questions using plain flamegraphs, you would have to quickly blink between them trying to spot the difference. Doable, yet far from convenient.
The latest version of clj-async-profiler introduces a solution to this problem in the form of differential flamegraphs (diffgraphs). I'll show you how to use them by concocting a toy example.
Let's start a REPL with [com.clojure-goes-fast/clj-async-profiler "0.4.0"]
loaded. First, we'll profile a piece of code that does some number crunching
involving different mathematical operations:
user=> (require '[clj-async-profiler.core :as prof])
user=> (prof/profile
        (dotimes [_ 10] (reduce + (range 10000000)))
        (dotimes [_ 10] (reduce / (range 10000000)))
        (dotimes [_ 10] (reduce * (range 10000000))))
The resulting profile might look like this. We see that the biggest chunk of time is spent dividing because integer division in Clojure uses ratios by default, and those are quite slow.
Now, let's say we've "optimized" the program to do this instead:
user=> (prof/profile
        (dotimes [_ 15] (reduce + (range 10000000)))
        (dotimes [_ 5] (reduce / (range 10000000))))
We do more additions, but fewer divisions, and multiplications are gone entirely.
Finally, we can generate a diffgraph from these two results:
user=> (prof/generate-diffgraph 1 2 {})
What you see above is a diffgraph. It might take a bit of effort to interpret, but it gets easier with practice. In a diffgraph, the frame width depends on the samples delta between two profiles. Thus, you can no longer treat the width as the proxy for the overall contribution of the frame to the program performance; rather, it shows the relative scale of change. The color signifies the direction of the change: a blue frame means that less time was spent in this function in the second profile (after) compared to the first (before); a red frame means that more time was spent in the second profile. The color intensity is an indication of the relative change in the number of samples for the frame itself.
For example, if you hover above clojure.core/*, it will tell you that the time
spent in this function has changed by -100%, which means it has disappeared
completely. This is consistent with the solid blue color. In the tooltip, it
will also show that the impact of this frame disappearance on the total
performance distribution is -16.56%. It means that in the first profile,
multiplication took 17% of the overall profile, but now it takes none.
Conversely, clojure.core/+ is heavy-red with +186.96% self increase, and
+11.50% total. That happened because, in the second profile, we ran the
additions more times (15 vs. 10), but that's not it. By default, when a
diffgraph is generated, it normalizes the number of samples between two
profiles. So, if something is going away, something else will fill its space in
the normalized flamegraph. In a similar fashion, clojure.core// (division) is
light-blue and reports only 3% self-decrease, even though we ran it twice fewer
times.
Normalizing the profiles before diffing them makes sense because the absolute number of samples might fluctuate between two separate runs even when you are running the exact same code, but the relation of samples within one run is quite consistent. However, you can also disable the normalization:
user=> (prof/generate-diffgraph 1 2 {:normalize? false})
This diffgraph now probably looks like what you expected: divisions dropped by 50%, additions grew by 50%, and the total execution time shrank. Just keep in mind that a non-normalized diff is more susceptible to sampling frequency variations and non-equal profiling durations, so be sure not to compare apples to oranges with this tool.
Like every flamegraph-rendering function in clj-async-profiler,
generate-diffraph supports the same options, for example, :transform (see
previous post for details).
Stack post-processing with :transform is even more useful for diffgraphs,
since modifications to code may change the parent frames causing the non-changed
children frames to misalign. With post-processing, you can hack around that.
Lastly, the numbers 1 and 2 we pass to generate-diffgraph are the profiler run
IDs. Each consecutive run is assigned an increasing ID, and you can now provide
that to generate-diffgraph and generate-flamegraph instead of the full path
to a stacks .txt file.
Clj-async-profiler has a function called serve-files which starts an HTTP
server on the given port and lists all generated flamegraphs as clickable links.
This function is especially useful if you profile an application running on a
remote server since you can't just open
file:///tmp/clj-async-profiler/results/ there.
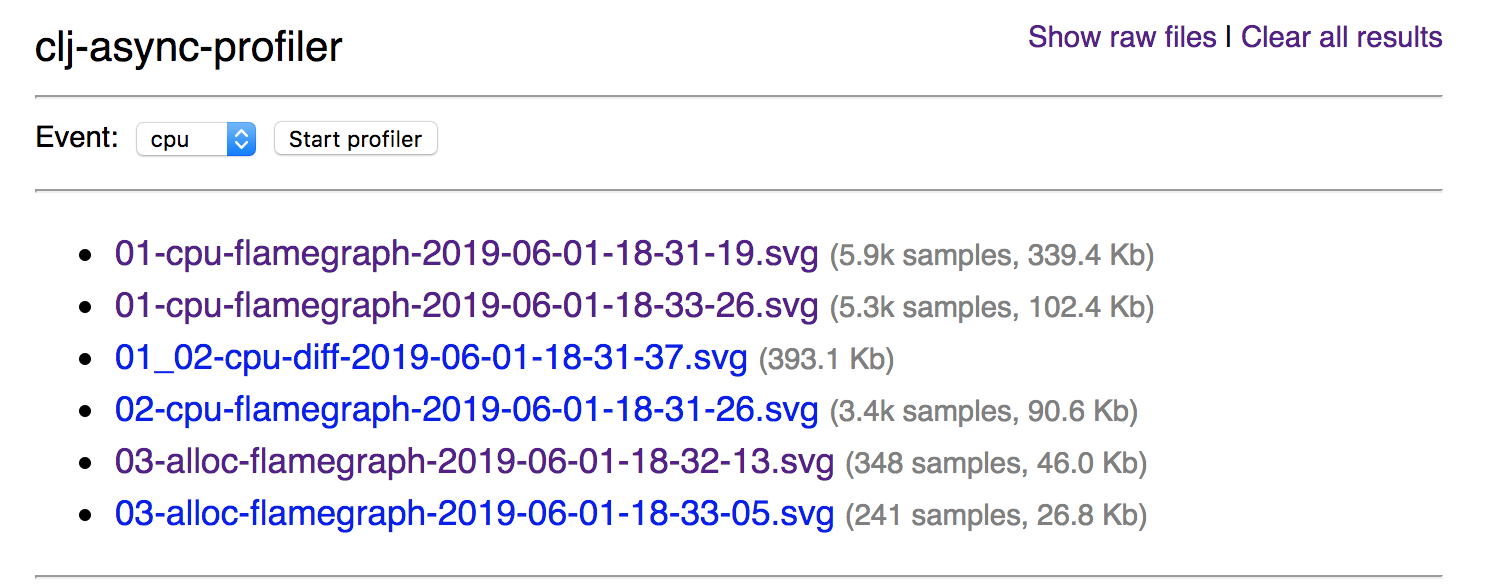
In version 0.4.0, this simplistic web UI got a minor facelift. The number of
samples is now displayed next to each flamegraph (so that you can promptly see
if you've collected enough). File names include the run ID (which can be passed
to generate-* functions) and the type of the profiled event.
A new addition is the ability to start and stop the profiler right from the UI. Of course, you can't provide most configuration options here, only the event type; so you'll have to resort to the REPL for finer tuning. Yet, in some cases, especially on a remote machine, it might be convenient to quickly generate a profile and immediately view it without leaving the browser.
For those who are worried about pulling surplus dependencies (and rightfully so) — the web UI in clj-async-profiler uses only core Java classes and renders HTML by mashing strings together, so you won't get any redundant JARs with this.
Because clj-async-profiler shamelessly piggybacks on async-profiler, we get effortless access to all the improvements in the parent library. Things that may possibly be implemented in the future include support for continuous profiling, distinct rendering of inlined frames, new profilable events, and so on. You can be sure you'll be the first to know when these and other features arrive, and until then, stay fast!