There is a class of operating systems called real-time operating systems (RTOS). They are typically applied in mission-critical applications where an unpredictable delay is equal to failure (think rockets, airplanes, military technology, high-frequency trading to some extent). The key characteristic of such systems is that they guarantee certain time bounds for execution. The latency coming from a system should be deterministic and usually very small. Of course, having to satisfy this guarantee puts strict constraints on the programming model. For example, dynamic memory allocation is often not available as it can potentially take a long time to succeed or even fail completely. Multitasking is either not allowed or very limited, with a specialized scheduler to manage it. The choice of hardware is narrower, and choosing the correct one is a careful process.
Now that you know what a RTOS is, let's face the truth that neither Linux nor
JVM belong to that category. We enjoy the capabilities that our systems
provide, like malloc, automatic garbage collection, preemptive multitasking on
process and thread levels. But for that we have to pay the price: a program
running inside may be arbitrarily interrupted, be starved for CPU for
indeterminate time, spin idly in various locks and
safepoints.
So, we accept that our programs may experience delays caused by the external
environment.
That, however, doesn't mean we don't want to know about those delays. The knowledge gives the ability to treat, or at least to predict, the lag in your program. It is hard to enumerate all possible sources of latency, figure out which exactly influence your program, and combine this information accurately. Gil Tene from Azul Systems chose a different approach — measure the outer delays from the inside of the program — and released it as a free tool called jHiccup.
jHiccup is a Java library that measures system-induced pauses and stalls. The idea behind jHiccup is trivially brilliant: if an idle thread that does nothing but sleeping is denied the CPU time by the system, then the real worker threads are likely to observe the similar effect. jHiccup starts a thread that sleeps for a defined interval and measures how much of actual time has passed. The difference between the desired and real sleep time becomes the length of the system "hiccup" for this cycle.
Of course, you can't expect Thread.sleep(1) to wake up precisely in one
millisecond even under ideal conditions when no hiccups are happening. But
obsessing about small fluctuations is not the point; the point is to discover
long pauses of tens or hundreds of milliseconds or even seconds. Those can be
caused by stop-the-world GC phases, stolen CPU cycles in virtualized
environments, unpredicted hardware effects, and other application-independent
reasons.
jHiccup can be used as a Java agent, a launcher-wrapper around your application, or a library. jHiccup writes the measurements into an HdrHistogram, another Gil's library, so that you can later obtain accurate latency percentile values over arbitrary measurement timespan.
Overall, jHiccup is an excellent library that I absolutely recommend to check out. However, its API is better suited for on-demand measurement rather than always-on setup. I, on the other hand, needed something that can be easily hooked into a monitoring solution and observed automatically. This is how I created jvm-hiccup-meter.
jvm-hiccup-meter is a minimalistic Java/Clojure library that exposes jHiccup's measuring code through a simple callback API.
You begin by adding com.clojure-goes-fast/jvm-hiccup-meter as a dependency.
Then:
user=> (require '[clj-hiccup-meter.core :as hmeter])

user=> (def hm (hmeter/start-hiccup-meter callback-fn :resolution-ms 10))

user=> (hm) ;; To stop the meter thread.
callback-fn is called on each measurement iteration and receives a perceived
delay in nanoseconds. You are free to do anything with this data, for example,
write it into Dropwizard Metrics:
(import 'com.codahale.metrics.Histogram
        'com.codahale.metrics.SlidingTimeWindowArrayReservoir
        'java.util.concurrent.TimeUnit)

(def hist (Histogram. (SlidingTimeWindowArrayReservoir. 10 TimeUnit/SECONDS)))
(def hm (hmeter/start-hiccup-meter #(.update ^Histogram hist %)))

;; Now, you can forward this histogram to Graphite, or check the values
;; manually, e.g.:
(.getMax (.getSnapshot hist))
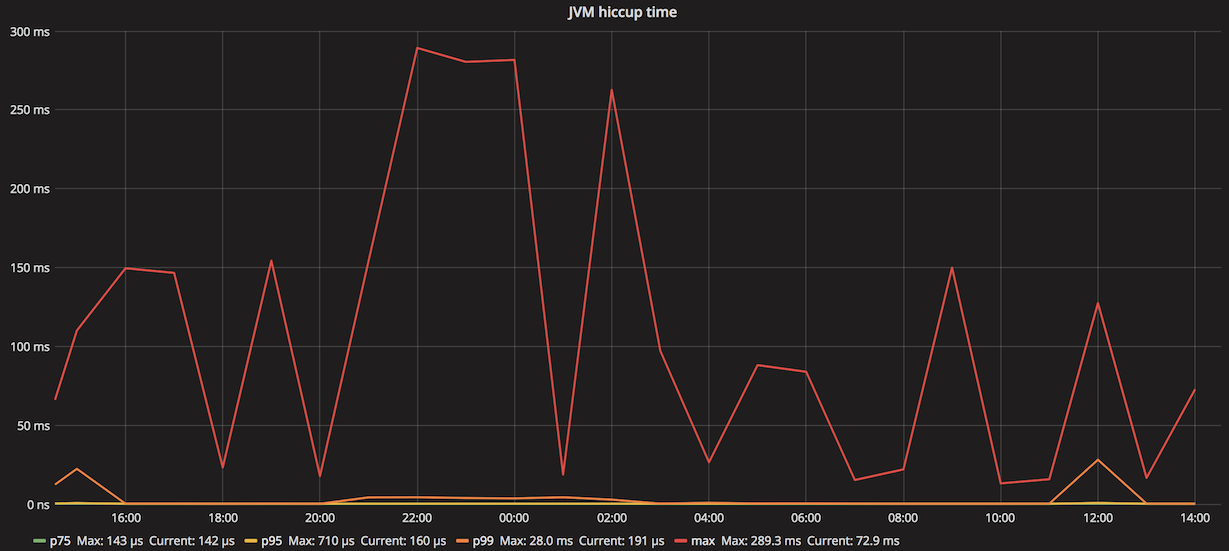
And this is how it can look on a dashboard:
To know a problem exists is the first step to solving it. Even if occasional JVM pauses may not necessarily be a problem in your application (today, at least), being able to see them can help with troubleshooting, root-cause analysis, and overall monitoring of system's health. As for me, I started including jvm-hiccup-meter in every service as an additional telemetry data source. I encourage you to try it too, and may your latencies be as low as you want them to be.