If benchmarking is discovering out how long a piece of code takes to run as a whole, then profiling means figuring out how much time each function, method, or instruction spends. What do programmers use profilers for? The primary purpose, of course, is to optimize their code. But you don't want to go tweaking and rewriting your code blindly, spending time on optimizations that might not even matter. Profiling gives you exactly that. It identifies who are the primary contributors to your program's execution time. Once you know them, you can focus on revising them first as it will have the biggest effect.
Many decent JVM profilers exist, but in this post, we will use the one called
VisualVM. It is not the most accurate or feature-rich profiler out there, but it
is free and actively developed. Actually, it is already included in your JDK
distribution, so you can immediately launch it as jvisualvm in your
terminal1. However, I recommend you grab
the version from the official website since its
release schedule is not tied to Java and it's more up-to-date there. If you
install it from the site, you'll have to launch it differently (e.g., it is
called "VisualVM" in Launchpad on MacOS).
Go ahead and start it now.
The interface of this tool is quite uncomplicated. On the left, you will see the Applications toolbar showing the local and remote Java processes that you can connect to. Since profiling Clojure is not much different from profiling Java apps, and VisualVM doesn't even know you are running a Clojure program, you just conn... wait, what?
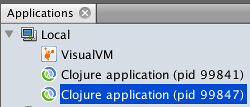
I'm running a single lein repl session, why do I see two Clojure processes? In
case you didn't know, Leiningen launches two processes per each session, one for
itself and one for application in use. There is a neat trick to figure out which
is which, with the JDK tool called jcmd1:

In this example, process 99841 is Leiningen's bootstrap JVM, and process 99847 is our actual REPL. They usually go in order, so you only have to remember to connect to the later one, but it is nice being able to double-check.
Note: Boot users don't have such problems, one Boot process = one JVM.
Let's connect to the second Clojure process by double-clicking on it in the Applications frame. VisualVM will hang for a few seconds and then will open its main window on the right. You will see multiple clickable tabs, Overview being the active one. Here VisualVM lists different parameters of the current JVM process. Monitor tab is like a dashboard for the process, showing CPU activity, memory usage dynamics, and some other things. Threads tab can sometimes be incredibly useful for understanding performance, but we won't focus on it today. We are here for profiling. Can you guess which tab you should click then?

Go home, Captain Obvious, it's not your day. We need the Sampler tab. To explain why it is so we'll have to take a little diversion and explore which types of profiles are there.
foo(),
and only 1 sample contains bar(), then foo must run 9 times longer than
bar. So, "Sampler" that is.
Before we begin the profiling, we need to give ourselves something to run. The following two functions will do.
(defn burn-cpu [op secs]
  (let [start (System/nanoTime)]
    (while (< (/ (- (System/nanoTime) start) 1e9) secs)
      (op))))

(defn test-one []
  (burn-cpu #(reduce + (map inc (range 1000))) 10))
The first function runs a nullary function op in a loop for the specified
number of seconds. The second function is but a façade to the first.
Switch to the "Sampler" tab and press the CPU button. You will immediately
see methods that sit around and do nothing. Now, execute (test-one) in your
REPL. In 10 seconds you will see something like this:
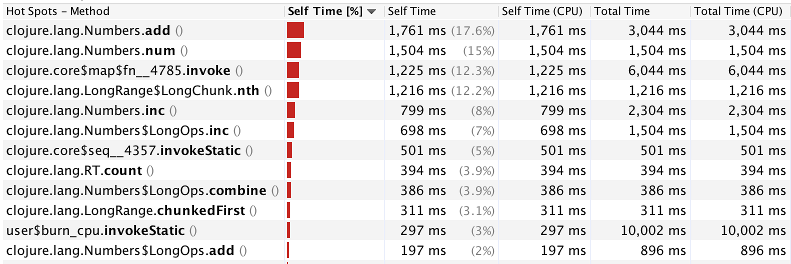
In an effort to make sense out of all this, let's start from deciphering what the columns mean.
Take, for example, the method user$burn_cpu.invokeStatic() (which corresponds
to our function burn-cpu). Its total time is 10,002 milliseconds because
during the whole sampler run we never returned from this function (only in the
end). But its Self Time is small because burn-cpu itself didn't really do much
besides spinning the loop and calling into the provided op.
The respective (CPU) columns show the chunk of time that the method was really
doing work on the CPU, not just waited for some event. In our simple test, the
CPU times are identical to corresponding total times because we don't do any
I/O, or locking, or Thread.sleep. For real code, those numbers will differ.
So, what does all this actually tell us? We can see that the bulk of time
spending happens in different methods of clojure.lang.Numbers class, so, short
of using unsafe math, you can't really accelerate those. Laziness also eats away
a considerable number of cycles (manifested by clojure.core$seq and methods
that have "chunk" in their names); we can speed that up by turning the code
eager. We won't be doing any of this today, but just looking at this simple
example through a profiler already gives us some insights and ideas.
Oh, and the best part. Since we are using Clojure, we can redefine any function in the REPL, and the sampler will pick up the changes immediately. We don't even have to reconnect to the process! This is so much more convenient than the typical Java workflow, and we are getting it with a tool that was originally designed for Java. That's the power of Clojure!
If you've never seen before how classes compiled by Clojure look like, you might
be confused by these weird names. First of all, $ in a class name represents
the inner class. So, map is an inner class in clojure.core and fn__4785 is
an inner class of map. And fn__XXXX is how the Clojure compiler internally
names the anonymous function. So, together, the method name in the title
corresponds to an invocation of some lambda defined inside the
clojure.core/map function.
When you sort the profiling results by "Total time" column, you will find the
method user$test_one$fn__19922 (the number will be different). This is our
lambda #(reduce + ...), defined in test-one! It has the Total Time of 10
seconds and the Self Time of 0 seconds because all it does is calling into
reduce and passing the result up.
In case you have multiple anonymous functions defined in a single named
function, and you're having a hard time recognizing which is which in your
profiling results, you can give them names by using (fn mylambda [...] ...)
syntax. Then, Clojure will generate a class name like
myns$myfunction$mylambda. But naming anonymous functions kinda defeats the
purpose, doesn't it?
There is even more profiling data hiding behind the Snapshot button (just
above the methods table, on the left). Click it. A new tab will open, with tabs
below. The current one, Call tree, starts with the list of threads that were
alive at the moment of profiling. Click on the arrow next to nREPL-worker-X
thread (thread where your REPL expression was executed).
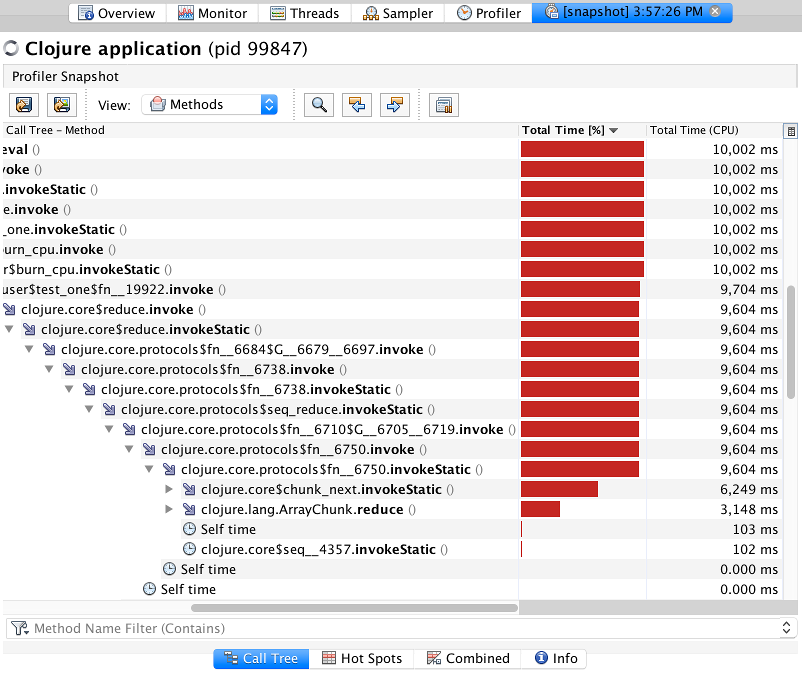
This view shows what the execution time of each method consists of. Generally,
it is made up of calls to other methods, and some percentage of "Self time." All
those methods that expanded automatically only call into the child method and
have next to none self-time — they are of zero interest to us. The first
function that has something going on inside is
clojure.core.protocols$fn__6750, because it calls both chunk-next and
ArrayChunk.reduce. From there, you can expand the stack frames further to see
what makes up the profile.
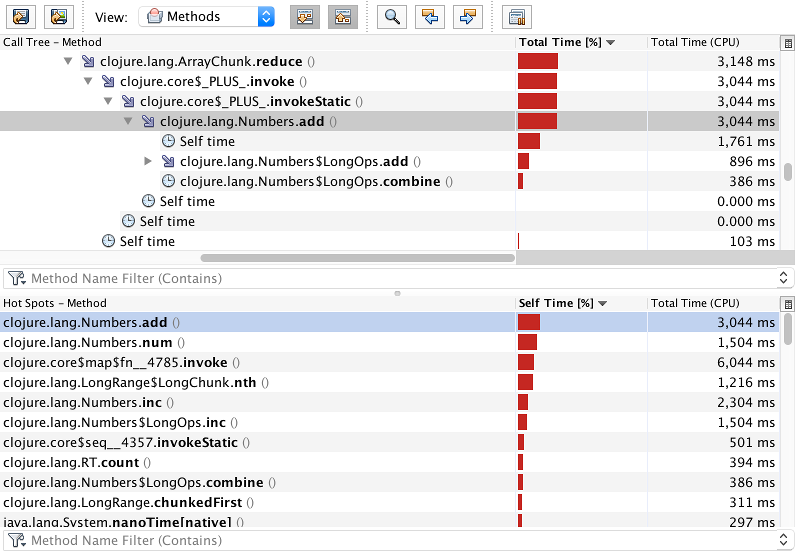
The next tab, Hot Spots is almost the same as the initial Sampler view, with the exception that you can filter the methods by a particular thread. Otherwise, not much else to say about it.
The Combined tab is very helpful. This view combines two previous tabs so you can select a hot method in the bottom frame, the upper frame will highlight this method in the call stack. When the same method is called from multiple spots, you are able to navigate between the call sites with the arrow buttons on the top.
Oh my, so many words written, and we haven't even touched upon the memory profiling! Indeed, profiling is a long and tough topic; the abundance of features and views in the profilers didn't appear on a whim — it spawned from a necessity to look at your application performance profile from different angles before making an educated guess. After all, even with all these tools, optimizing the performance is still a kind of magic — it requires plenty of experience and some good intuition.
Now that you know how to use a profiler, what you should look for when profiling your own programs? A common approach is to search for "plateaus" — methods with high total time percentage and simultaneously big self-time. Such methods have expensive bodies optimizing which will give the most significant performance boost. Another potential for improvement comes from "odd" methods that spend more time than they should due to a bug or unmet assumption. Each such method may not weigh much on its own, but optimizing a few of those may improve the performance as much as rewriting a single wide plateau.
This post comes to its end. It surely couldn't teach you all the tricks and practices to profiling, but hopefully, it gave you the basis to start exploring on your own. In future posts, we will cover some frequent patterns that slow down your Clojure application. Until then, stay tuned!
command not found when launching
jvisualvm or jcmd, then your PATH might not contain the path to JDK
binaries. Consult the JDK installation manual for your OS.↑