This short tutorial will show, by example, how to use clj-async-profiler to profile your programs. We'll be using the Clojure CLI tool in this tutorial. You can follow along or download the final code from here.
First, let's create a sample project that we are going to profile. Do this in your terminal:
$ mkdir -p profiling-tutorial/src/tutorial/
$ cd profiling-tutorial
Create a file deps.edn with the following content:
{:paths ["src"]
 :deps {com.clojure-goes-fast/clj-async-profiler {:mvn/version "1.4.0"}}
 :aliases
 {:attach {:jvm-opts ["-Djdk.attach.allowAttachSelf"]}}}
If you follow this tutorial on Linux, you should also execute this to let the profiler access perf events:
$ sudo sysctl -w kernel.perf_event_paranoid=1
$ sudo sysctl -w kernel.kptr_restrict=0
Next, create a file src/tutorial/binary_trees.clj with the following content.
This will be the code that we are going to profile. It is taken from
clojure-benchmarks
repository that contains solutions to Alioth Benchmarking Game tasks.
(ns tutorial.binary-trees)

(deftype TreeNode [left right ^int item])

(defn bottom-up-tree [item depth]
 (let [int-item (int item)
       int-depth (int depth)]
   (if (zero? int-depth)
     (TreeNode. nil nil (int item))
     (TreeNode. (bottom-up-tree (dec (* item 2)) (dec depth))
                (bottom-up-tree (* item 2) (dec depth))
                (int item)))))

(defn item-check [^TreeNode node]
  (if (nil? (.left node))
    (.item node)
    (+ (.item node)
       (item-check (.left node))
       (- (item-check (.right node))))))

(defn iterate-trees [mx mn d]
  (let [iterations (bit-shift-left 1 (+ mx mn (- d)))]
    (format "%d\t trees of depth %d\t check: %d" (* 2 iterations) d
            (reduce + (map (fn [i]
                             (+ (item-check (bottom-up-tree i d))
                                (item-check (bottom-up-tree (- i) d))))
                           (range 1 (inc iterations)))))))

(defn main [max-depth]
  (let [min-depth 4
        stretch-depth (inc max-depth)]
    (let [tree (bottom-up-tree 0 stretch-depth)
          check (item-check tree)]
      (printf "stretch tree of depth %d\t check: %d\n" stretch-depth check))
    (let [long-lived-tree (bottom-up-tree 0 max-depth) ]
      (doseq [trees-nfo (map (fn [d]
                               (iterate-trees max-depth min-depth d))
                             (range min-depth stretch-depth 2)) ]
        (println trees-nfo))
      (printf "long lived tree of depth %d\t check: %d\n"
              max-depth (item-check long-lived-tree)))))
Now we are ready to launch the REPL. Here, we'll run a simple terminal REPL like this:
$ clj -A:attach
The :attach alias is needed to add -Djdk.attach.allowAttachSelf to the JVM
launch options. If you start REPL from the editor of your choice, make sure to
also include this alias, or add -J-Djdk.attach.allowAttachSelf directly to the
command string. Starting from Java 11, this is required so that
clj-async-profiler is able to dynamically attach to the running process. Once
the REPL starts, let's do the following:
user=> (require 'tutorial.binary-trees)
nil
user=> (require '[clj-async-profiler.core :as prof])
nil
user=> (prof/profile (tutorial.binary-trees/main 20))
Profiling started
...
user=> (prof/serve-ui 8080)
So, we loaded the namespaces with the code and the profiler. Wrapping the code
we want to profile with profile macro starts the profiler, executes the given
code, stops the profiler, records the results, and generates the flamegraph.
The final function, serve-ui, starts the web UI and binds on the given port.
Open localhost:8080 in your browser to see this:
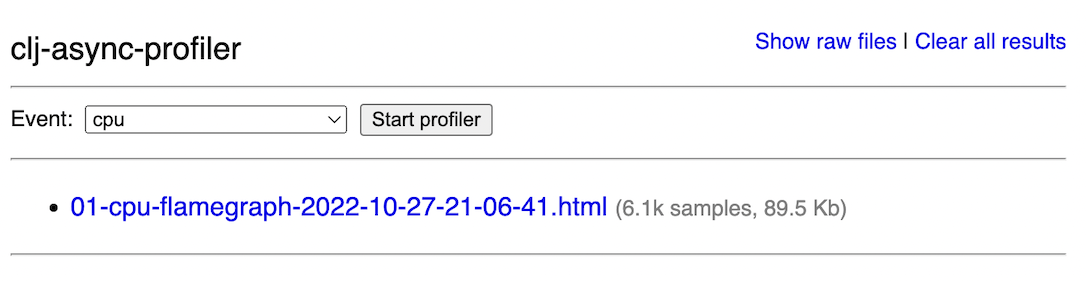
For now, just click the link that says "flamegraph" to open the generated flamegraph.
This flamegraph is interactive; you can click on the stackframes to drill down
functions, hover the frames, so the tooltip tells you how much CPU time the
particular function takes, and so on. You can learn more about how to read,
interpret, and even transform flamegraphs in the article Exploring
flamegraphs. But for
now, just by briefly looking at the flamegraph, it is apparent that the most
time is spent within two recursive functions — bottom-up-tree and item-check
— and the former is mainly occupied with running Numbers.multiply method,
which is a sign of using boxed math. On the right, you'll also see that the
garbage collection work also made an appearance on the profile, which could mean
that the profiled code is allocation-heavy.
Recursive functions like the one you see above are notorious for being inconvenient to profile, but later we'll learn tricks to elucidate even the most convoluted recursive graphs.
Two basic functions that control the profiling workflow are start and stop.
Calling start will begin collecting the profiling data. start accepts a map
of options:
:event — the most important option, it selects which type of profiling is
going to happen. The default is :cpu which stands for regular CPU profiling.
See Event types.:threads — if true, the profiling data will be presented for each thread
separately. Note that this does not improve the resolution of the profile; it
only separates the results by-thread.:features — a list of additional features to enable. Instead of a list, you
can pass a keyword :all that means enabling all features. Currently
supported features:
:vtable — show targets of vtable/itable calls. Helps to understand which
specific polymorphic dispatch is causing the slowdown.:comptask — show JIT compilation task. Useful when trimming down
application load time.:interval — sampling interval in nanoseconds. The default is 1000000, which
means one millisecond. You can try setting it closer to 100000 (100
microseconds) to increase the resolution of the profile, but the operating
system probably won't let you reduce it further. Also, decreasing the interval
increases the profiling overhead. To obtain more data, running the profiler
for longer is usually better than tampering with the sampling interval.:framebuf — the buffer size in bytes that the profiler internally uses,
defaults to 1000000 (1MB). You can try increasing this value if your profile
shows many [frame_buffer_overflow] samples; otherwise, you don't have to
change this.:pid — process ID can be provided to profile an external Java process
instead of the current one.The profiler collects samples until stop is called. Besides stopping the
profiler, it does some post-processing of the result, dumps the result into a
text file, and generates a flamegraph from this result file. Both are saved into
the /tmp/clj-async-profiler/results/ directory. stop also accepts a map of
the following options:
:generate-flamegraph? — defaults to true, but if set to false, it will only
dump the result to a text file.:title — optional title to be included in the generated flamegraph (for
example, to differentiate between several profiling sessions).:predefined-transforms — pertains to advanced in-browser flamegraph
transforms, see Live
transforms.:pid — if you called start with a specific PID, you should also supply it
here.Having separate functions for starting and stopping gives flexibility, but you
will most of the time use all-in-one functions. profile is a macro that
performs profiling for the duration of the execution of the supplied body. Note
that the profiler runs process-wide, so even though it might look like you are
only profiling the wrapped code, the profiler will still pick up other
computations that might be running in the background. profile optionally takes
a map of options as its first argument. This map will be internally passed to
both start and stop, so the supported options are the same.
profile-for is a function that profiles the process for the provided duration
in seconds. Obviously, the code you want to profile should already be running in
the background in another thread(s).
generate-flamegraph can be invoked manually by giving it the profiling result
text file and the same options map like stop expects.
generate-diffgraph is used to create differential
flamegraphs — special flamegraphs
that highlight differences between two similar but divergent profiles. The
function takes two profiling result text files and a map of options for stop.
list-event-types prints the list of event types supported by the current
machine. See Event types.
status returns a string that says whether the profiling is in progress.
serve-ui starts an embedded Web server that serves in-browser UI on the given
host and port.
clj-async-profiling works by collecting the stack traces of all threads within
the process when a specific event happens. By default, the event called :cpu
is used, which means sampling all threads in the RUNNING state at the
specified interval. In this mode, the profile will only include code that
actively performs work on the CPU and not such, for example, that spends time
waiting for I/O.
You can see the list of other supported event types by calling
(list-event-types). On all platforms, at least the following basic events
should be available:
:alloc — used for allocation
profiling.:lock — collect stack traces of threads that contend on acquiring locks.:wall — like :cpu, but include stack traces of BLOCKED and WAITING
threads.:ctimer — fallback event type for CPU profiling that doesn't use perf and
thus only sees Java stack frames without the native ones. You can try
profiling this event type if you have problems generating a :cpu profile.
This event type is only available on Linux.:itimer — another fallback even for CPU profiling, even less precise than
:ctimer, but has better compatibility.On a Linux machine, you will see more supported events powered by Performance Monitoring Counters, such as cache misses, branch misses, page faults, context switches, etc. You can try profiling with those if you suspect a bottleneck is caused by one of those and you want to discover the places in the code that trigger the largest number of such events.