Flamegraph is an incredibly intuitive tool for presenting profiling data. However, it is not immediately obvious how to compare profiling results if you have two of them. Say you implement an optimization or a change to the algorithm, and now you want to know how exactly that influences the performance profile. Is the change noticeable on the flamegraph? Did you gain some speed in one place only to lose it in another? To answer these questions using plain flamegraphs, you would have to quickly switch between them, trying to spot the difference. Doable, yet far from convenient.
There is a solution to this problem in the form of differential flamegraphs (diffgraphs). In this article, we'll learn to use them by walking through a toy example.
Let's start a REPL with clj-async-profiler loaded. First, we'll profile a piece of code that does some number crunching involving different mathematical operations:
user=> (require '[clj-async-profiler.core :as prof])

user=> (prof/profile
        (dotimes [_ 10] (reduce +' (range 1 10000000)))
        (dotimes [_ 10] (reduce *' (range 1 20000)))
        (dotimes [_ 10] (reduce / (range 1 10000))))
The resulting profile might look like this. We see that the biggest chunk of time is spent dividing because the integer division in Clojure uses ratios by default, which are pretty slow.
Now, let's say we've "optimized" the program to do this instead:
user=> (prof/profile
        (dotimes [_ 20] (reduce +' (range 1 10000000)))
        (dotimes [_ 5] (reduce / (range 1 10000))))
We do more additions, but fewer divisions, and multiplications are gone entirely.
Finally, we can use generate-diffgraph function to create a diffgraph. This
function takes three arguments — the paths to "before" and "after" profiling
results (txt files) and the options map. Instead of full paths to text files,
you can provide numeric IDs — those same IDs that you can see at the beginning
of flamegraphs' filenames, like 01.
user=> (prof/generate-diffgraph 1 2 {})
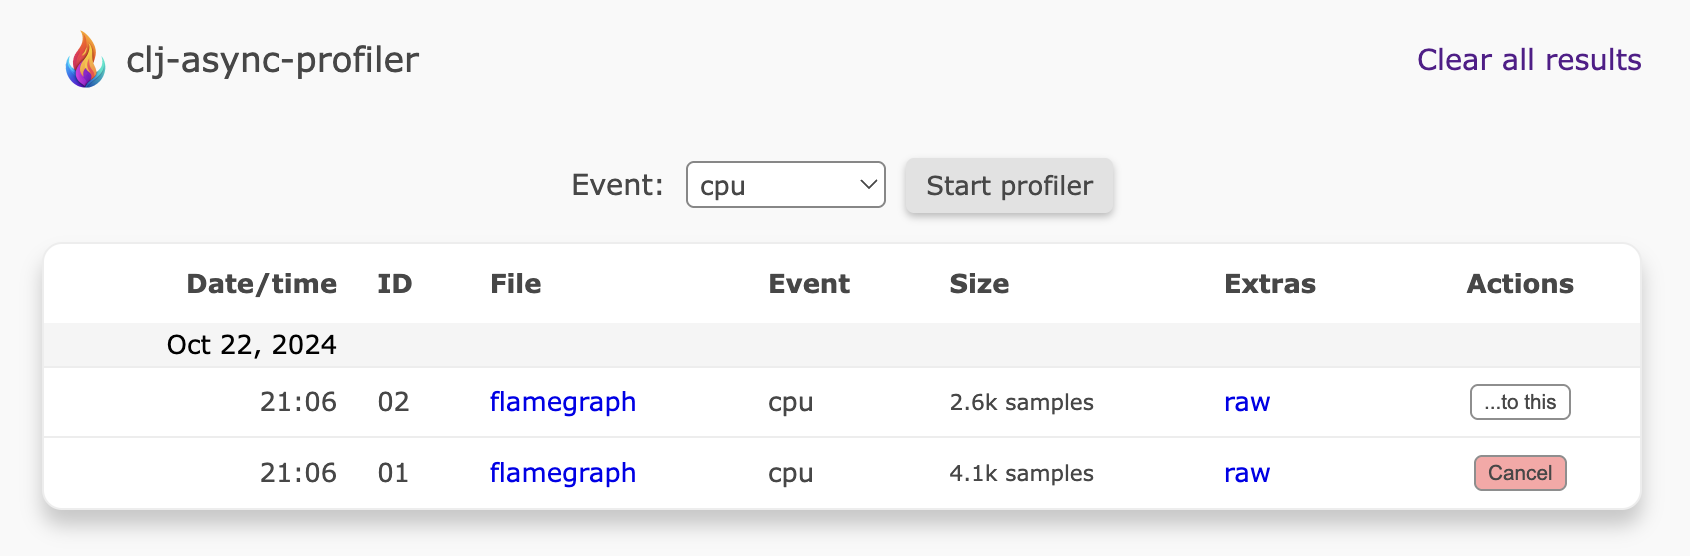
Alternatively, you can go to web UI and click the button that says "Diff to..." in the row of the first flamegraph. The button will change to "Cancel" (which cancels the operation), but the button in the second flamegraph's row will change name to "...to this". Clicking it will create a diffgraph between those two profiles.
What you see above is a diffgraph. In a diffgraph, the frame width depends on the samples delta between two profiles. Thus, you can no longer treat the width as the proxy for the overall contribution of the frame to the program performance; rather, it shows the relative scale of change. The color signifies the direction of the change: a blue frame means less time was spent in this function in the second profile (after) compared to the first (before); a red frame means more time was spent here in the second profile. The color intensity indicates the relative change in the number of samples for the frame itself (self time delta).
For example, if you hover above clojure.core/*', it will tell you that the
time spent in this function has changed by -100%, which means it has disappeared
completely. This is consistent with the solid blue color. The tooltip will also
show that the impact of this frame disappearance on the total performance
distribution is -28.47%. It means that in the first profile, multiplication took
28.47% of the overall profile, but now it takes none.
Conversely, clojure.core/+' is red with +68.03% self increase and +2.95%
total. That happened because, in the second profile, we ran the additions more
times (20 vs. 10). And the divisions (clojure.core//) are light blue (-47.20%
self) because we ran them half as many times. The overall profile is also light
blue with -50.18% total which signifies that less work has been done overall in
the second profile.
Diffgraphs have a unique toggle on the side panel called "Normalized". If you check that box, the diffgraph will start looking a lot different. When enabled, the normalized view adjusts the total number of samples between the two compared profiles to be the same. This can be useful if the two profiles you've taken were not taken on the same hardware or for the same durations, so you not as much interested in the absolute sample numbers but more in the relative differences between flamegrpahs.
Like regular flamegraphs, diffgraphs also support live transforms. Stack post-processing is even more helpful for diffgraphs since modifications to code may change the parent frames causing the unchanged children frames to misalign. With live transforms, you can bring the diverging stacks back together so that they diff nicely.