Among available Java profilers, clj-async-profiler is a great candidate to be used in a production environment. It has very low overhead and a convenient in-browser UI. No software has to be installed on the local machine to perform the profiling or view the results.
Why profile in production? Because no matter how diverse and representative your test data is, the real production data and the actual production behavior make the most accurate environment to measure what parts of your code are the bottleneck. It doesn't mean that you don't need to profile locally in-dev at all — it is still a valuable activity that can catch performance bloopers ahead of time and give you an overall idea about where your program is the slowest. But being able to profile in production increases your familiarity with the performance of your code even further.
Using clj-async-profiler in production is not much different from using it locally, except you have to set up a couple of things upfront. First of all, make sure that capturing perf events is allowed for non-root users (since you will most probably run your service on Linux):
$ sudo sysctl -w kernel.perf_event_paranoid=1
$ sudo sysctl -w kernel.kptr_restrict=0
Next, you will need a spare open port to bind clj-async-profiler's web UI to. The web UI doesn't offer any authorization capability, so make sure to either:
localhost and then use SSH port forwarding to
access the UI only after you establish a secure shell;In any case, avoid opening your profiler UI to the wide world unprotected.
It is a good idea to add -XX:+UnlockDiagnosticVMOptions -XX:+DebugNonSafepoints JVM flags to your application's startup command. As per
async-profiler
documentation,
this will increase the accuracy of the profiling results. These flags are not
limited to production profiling, feel free to include them in your dev setup as
well.
Inside your application, you would need to require clj-async-profiler.core as
usual and then run this at some point during your app's initialization:
(prof/serve-ui <host> <port>)
You should choose hostname depending on your strategy of protecting the UI from
the outer world. It is advised to avoid the catch-all 0.0.0.0.
If you ship your application as a Docker container, you need to give it the
access to the perf_event_open syscall. For that, Docker's seccomp
profile has to be modified to
allow this syscall. The container would also need the --cap-add SYS_ADMIN
capability. If you have a dedicated operations team, such configuration is
usually handled by them.
Alternatively, you can use :ctimer or :itimer event type as a fallback for
:cpu. It would work without the perf events, but you would lose the data about
native code stacks.
If set up correctly, you should be able to open the UI by visiting the IP
address of your server and the port that you provided to serve-ui. You should
see a page like this:
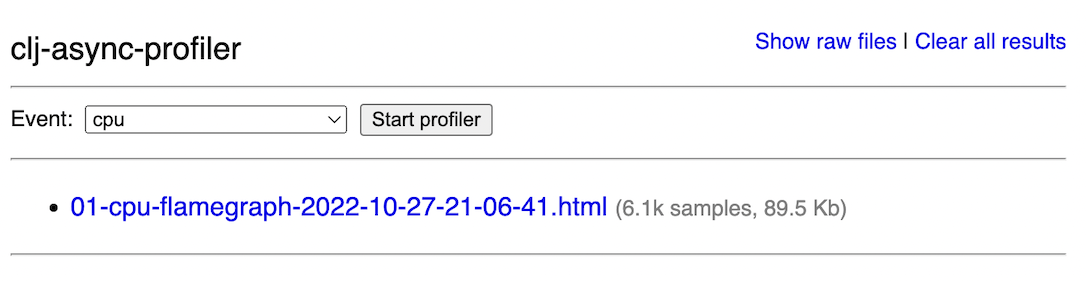
In production scenarios, the Web UI enables the following operations:
For the first one, a dropdown menu that says "cpu" can be used to select a different event type. Then, you can click "Start profiler", and the profiling will commence. The button will change its caption to "Stop profiling." Once that is clicked, the profiler will stop and generate a flamegraph. It is assumed that your service already does something in the background, be it serve traffic or do batch processing, so you don't have to supply code to profile like you usually do at dev time.
Below the profiler controls is the list of all generated profiles. Clicking on the link will open the flamegraph. The scheme used to name the flamegraph files is the following:
<timestamp>-<profile_id>-<event_type>-flamegraph.html
profile_id can be used to refer to a profile run in functions like
generate-flamegraph and generate-diffgraph.
Each flamegraph row has a column showing the number of samples the profiler
collected during this run. Use this to quickly check if you've collected enough
samples during profiling — for cpu event type, aim to get at least 1000
samples.
At the top right corner there is a link to delete all profiling results.
When you control the profiler from the REPL, it is easier to provide the
profiling options ad-hoc. But you can't do that when launching the profiler from
the UI. In that case, you can call set-default-profiling-options during
initialization and give it a map of options. This option map will then be passed
to all profiling commands, invoked both from the code and the UI. For example,
you can set the default predefined
transforms
for all flamegraphs generated on this machine.