In this article, you'll learn to interpret the contents of a flamegraph, what display options can be changed, and even how to live-transform flamegraphs to make the hot regions stand out more prominently.
A flamegraph is a visualization of stack traces of profiled software that makes the hot paths of code stand out distinctly so they can be easily identified.
Let's go through a simple example. Imagine we profile a program that has a
function foo, which does some work of its own and calls another function
bar, which in turn calls baz. There is another top-level function, qux,
that calls into corge. We take 10 samples of the executed code, which means we
count the times each stack appears on the running thread. Let's say we obtained
something like this:
foo         1
foo;bar     2
foo;bar;baz 5
qux;corge   2
The stack is recorded as semicolon-separated stack frames, and next to it is the number of times this stack was observed. Just looking at this textual presentation can already give us some insights, especially if we sort it by the sample count. But a flamegraph is more lucid:
We can see that foo occupies 80% of the execution time, but only 10% is the
function's self time. By self time, we mean time within a function spent on
arithmetic operations, memory accesses, control flow — anything but calling
other functions. bar takes 70% of the total time and 20% self time — so it's a
better candidate for optimization than foo. baz takes 50%, and all of that
is self time, so this function should be looked into first if we want to reduce
the execution time. Finally, both qux and corge take 20% of total time,
which means qux spends no time on its own — all lengthy work it does involves
calling corge.
In general terms, a flamegraph is a two-dimensional representation of code
stacks together with how much relative time they spend compared to each other.
On the Y axis, you have stacks that grow from bottom to top. The position of the
frame signifies which function calls which, and the height of the flamegraph
conveys only the stack's depth, which usually is not an important metric. On the
X-axis, the width of a frame represents how much total time is spent within that
function. The coordinate of the frame on the X-axis does not imply its
position in time; in fact, it conveys no meaning at all. In our example above,
foo coming before qux on the flamegraph does not imply that foo was called
before qux. Note that the absolute number of samples does not relate to the
number of times any function has been called, just to how long the profiler was
running. A sampling profiler like clj-async-profiler cannot differentiate
between a function being called once and spending a lot of time, and being
called a million times, each taking a short amount.
In some cases, a function having a big total percentage could be meaningful. For
example, we might know that foo should not be invoking bar so much, so we
might decide to rethink the algorithm for foo. In most other cases, you would
be hunting for frames with so-called plateaus — meaning the frame has a wide
area with no frames on top, indicating the function has high self time. In the
example above, functions with large plateaus are baz (50%), bar (20%), and
corge (20%).
One signifcant advantage of flamegraphs is their portability and shareability.
clj-async-profiler generates flamegraphs as standalone HTML pages that you can
open in any browser, send to your coworker, attach to a pull request, or embed
into a webpage using <iframe>.
Let's study in detail the flamegraph that we generated back in Basic usage. Feel free to interact with it on this page or open it in a separate tab.
Two fundamental interactions with a flamegraph are hovering the mouse cursor
over the frames and clicking on them. Hovering over a frame shows information
about that frame as a tooltip and at the bottom. Clicking a frame narrows down
(zooms in) the view on that particular frame so that only stacks that include
that frame are shown. Note that zooming in does not change the percentages shown
in the tooltip. Clicking a grayed-out frame will zoom out to that level, and you
can always reset the zoom by clicking the bottom-most all frame.
The sidebar on the right provides additional ways to interact with the
flamegraph. Let's start with the field that says "Search string or /regex/". You
may notice that because of how Clojure sequence iteration is implemented, the
execution of lambda inside iterate-trees is split into several codepaths.
Let's type bottom-up into that field click the magnifying glass button or
press Return. The frames that contain this string will get a magenta tint, and
on the bottom of the flamegraph, it will say "Matched: 59.01%". This means that
the function bottom-up-tree spends 59% of the total time across all codepaths
it is called in. Now, change the highlight to item-check. See that it now says
"Matched: 29.53%". You can also highlight specific frames accross the whole
flamegraph by right-clicking a frame and selecting "Highlight" in the pop-up
menu.
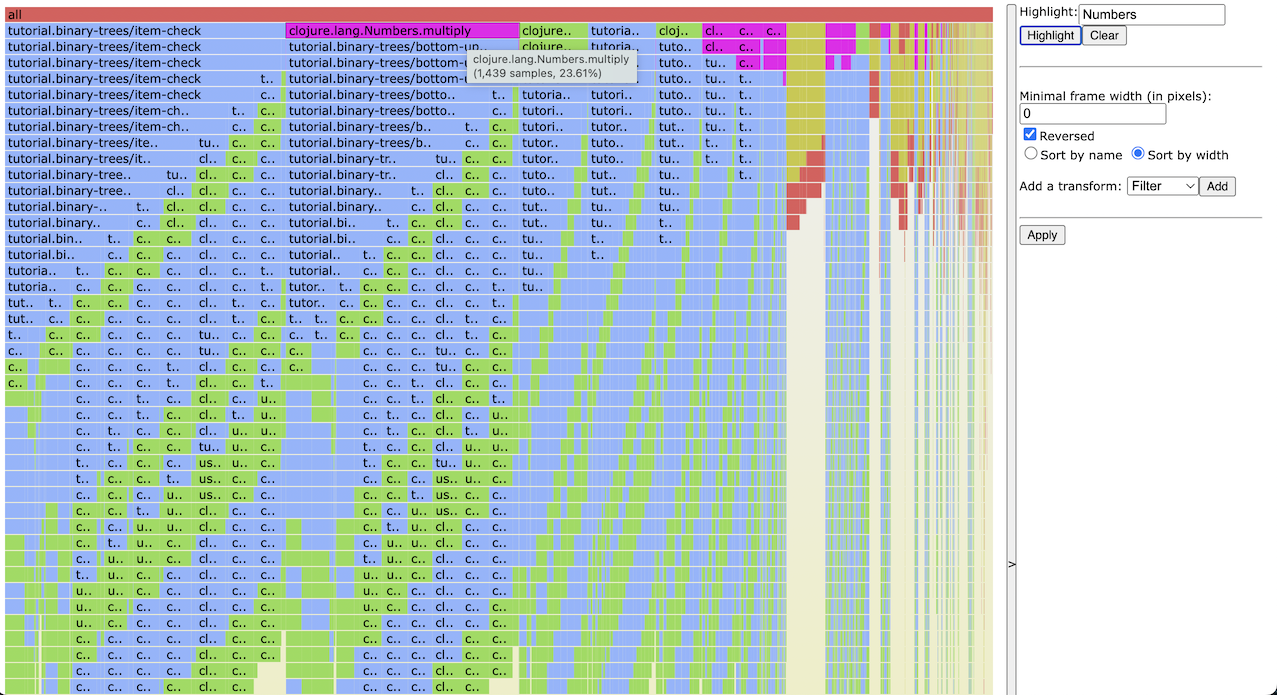
The Reversed button enables an interesting view. Toggling it will draw the
stacks from top to bottom. This basically highlights the functions with the
highest self time. You can quickly see that the Numbers.multiply method has
27.98% of self time, and the next expensive function is item-check with
20.94%.
Toggling the Sort by name/width selector changes the order of the frames on the X-axis. As was said before, the position of frames on the X-axis is arbitrary and carries no information. Sorting frames by width simplifies visually identifying the most expensive callees of a function if there are many of them; but sorting by name can sometimes be useful too.
The final section on the sidebar allows us to transform the stacks in the flamegraph. You can add any number of transforms that could be one of the three possible types: Filter, Remove, or Replace, with the latter being the most useful. As a reminder, the stacks in clj-async-profiler are represented like this:
;frame1;frame2;frame3;frame4;
A regex-based Replace transform is allowed not just to rename individual frames but also to elide frames or even introduce new frames (if that's ever needed). But regardless of what replacement you are doing, the total number of samples remains the same. You don't lose any data; you just redistribute it to other stacks.
However, you don't have to write most of the transforms by hand. A menu that
pops up when you right-click any stackframe on the flamgraph gives easy access
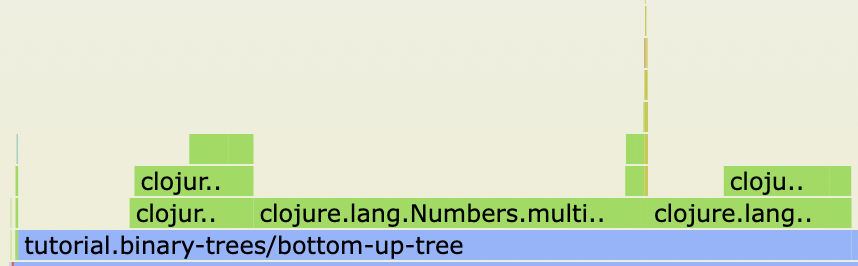
to many common transforms. Let's deal with those nasty recursive frames that
obscure what's really going on. Right click any of the recursive
bottom-up-tree frames, select "Collapse recursive", and voilà! Recursive
bottom-up-tree has turned into a nice flat frame. We can now see much more
clearly that it spends most of its time calling Numbers.multiply,
Numbers.dec, and RT.intCast.
You can also do the same with item-check. Right-click that stackframe and
select "Collapse recursive".
Another thing you can do with transforms is filtering out unwanted stacks. Our
flamegraph captured some garbage collector work that you might not need to look
at right now. Sure, you can just zoom into your own code, and those GC stacks
will be hidden, but this way, they are still counted in the total percentage.
Sometimes we don't want that, let's right-click the frame thread_start at the
bottom (as it's a common entrypoint to that GC code) and select "Remove
containing stacks". Now, clojure.main.main accounts for 99.79% of execution
time.
One final step that can clear things up for us. We've already seen that the
execution inside the function iterate-trees got split into two code paths
because that's how Clojure lazy sequences behave. Let's try to converge those
code paths, and this time, we'll have to write a transform manually. First,
click the "+Replace" button on the sidebar. By looking at the flamegraph, we
have to find where the paths diverged and at which frame we want to bring them
back together. Here, they split at clojure.core.protocols/seq-reduce, and we
can merge them at iterate-trees/fn--10479. The regex for the first empty field
will look like this:
/(seq-reduce;).+;(tutorial.binary-trees\/iterate-trees\/fn--10479)/
This regex matches the end of the seq-reduce frame, then an arbitrary number
of frames after it, and ends with the mentioned fn--10479 frame. Finally, we can
type $1$2 as a replacement to drop all those frames in between, and press Return.
Behold the result of our work. Try unchecking the checkboxes next to each transform. This is what we started with. Check them back again. The flamegraph got much more revealing.
The live transforms are great for ad-hoc exploring, but unfortunately, you can't
save and transfer them across different profiles (besides manually copying
regexps). But in big stable applications which you regularly profile, you might
have transforms that you always need and don't want to redo them every time. To
accommodate this scenario, the functions profile, stop,
generate-flamegraph accept an option called :predefined-transforms.
;; Notice how we use Clojure's regular expression syntax here. It will
;; be converted into JavaScript's regex syntax automatically.

(prof/profile-for
 10
 {:predefined-transforms [{:type :replace
                           :what #"(;tutorial.binary-trees/bottom-up-tree)+"
                           :replacement "$1"}
                          {:type :replace
                           :what #"(;tutorial.binary-trees/item-check)+"
                           :replacement "$1"}
                          {:type :remove
                           :what "thread_start"}
                          {:type :replace
                           :what #"(seq-reduce;).+;(tutorial.binary-trees/iterate-trees/fn--442)"
                           :replacement "$1$2"}]})
This option allows for baking common transforms directly into the HTML. Once baked in, you are still able to modify and disable those transforms. The command above will produce a flamegraph like the one above, which already contains the specified transforms.